98.3% of Singapore Condo Subsales Made Money — But What Does That Really Mean?

Updated: 2 days ago
I came across a statistic recently that sounds almost too good to be true.
98.3% of condo subsale transactions made money.
If I were selling a new launch, I could probably stop the presentation right there.
Put the number in a huge font.
Circle 98.3%.
Then say:
“See? This is why buying new launch works.”
Except that isn’t what the statistic proves.
The data itself is interesting.
But I think the more useful lesson is learning how to read the number properly.
Because one of the easiest mistakes investors make — whether in stocks or property — is confusing a good statistic with a complete argument.
First, What Exactly Does 98.3% Mean for Condo Subsales?
EdgeProp analysed more than 5,000 condo subsale transactions across Singapore’s CCR, RCR and OCR between January 2021 and August 2026 using URA Realis data.
It found that 98.3% were resold above their original purchase price after accounting for Seller’s Stamp Duty.
For context, a subsale refers to a unit that is resold before the development receives its Certificate of Statutory Completion.
So these aren’t ordinary resale transactions from 10- or 20-year-old condominiums.
They are generally relatively recent new-launch purchases sold again before completion.
On the surface, the result is impressive.
Only 76 transactions in the analysis recorded a loss.
But before turning 98.3% into an investment rule, there are a few things we need to understand.

The First Problem: We’re Only Looking at Units That Were Sold
This is probably the biggest caveat.
EdgeProp explicitly notes that:
Units bought from developers but not subsold during the period are excluded from the analysis.
That’s important.
Imagine 100 people buy a project.
Twenty owners are sitting on substantial profits and decide to sell.
Eighty owners don’t sell.
Now suppose all 20 sellers make money.
The subsale profit rate is:
100%.
But can we conclude that 100% of the original buyers made money?
Obviously not.
We know what happened to the transactions that occurred.
We don’t know what would have happened if every owner had been forced to sell on the same day.
This is a classic selection problem.
Owners with attractive profits may be more willing to transact.
Owners who would realise a loss may simply continue holding.
That doesn’t make the 98.3% statistic wrong.
It means we need to be precise about what it measures.
It measures completed subsales.
Not the investment outcome for every person who bought a new launch.

Second, “Profit” Isn’t Necessarily Net Profit
This is another crucial distinction.
EdgeProp’s analysis accounts for Seller’s Stamp Duty.
But it explicitly excludes costs including:
- the original Buyer’s Stamp Duty,
- Additional Buyer’s Stamp Duty where applicable,
- sales commission,
- and other transaction costs.
That means:
Sale price above purchase price does not automatically equal money in your pocket.
Imagine you buy a property for $2 million.
Later you sell it for $2.1 million.
Headline capital gain:
$100,000.
But then subtract:
Stamp duties,
Legal fees,
Financing costs,
Sales commission,
And perhaps other holding costs.
Your economic profit could be substantially lower.
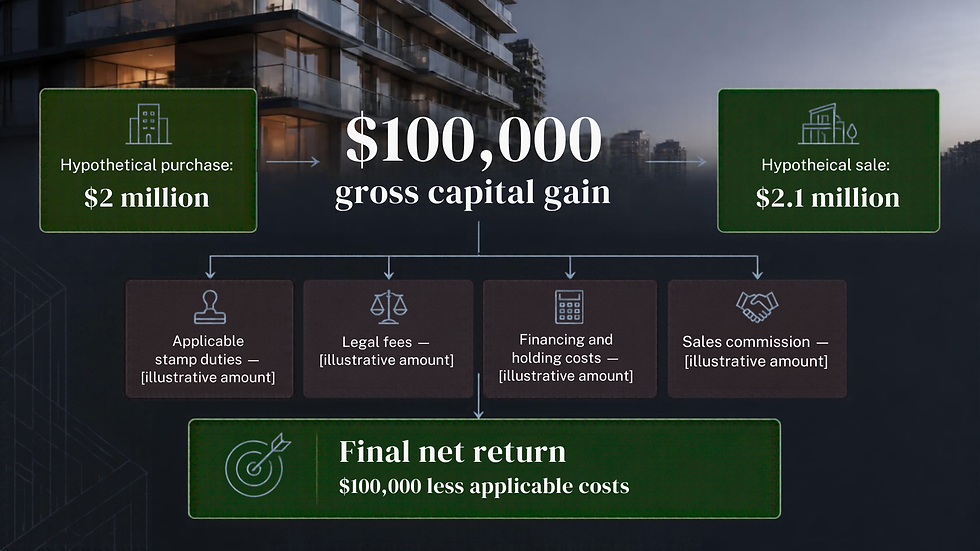
In some cases, what looks like a gain based purely on purchase and sale price might become a loss after all costs are included.
In fact, EdgeProp identified another nine transactions that sold at exactly their original purchase price and noted that these likely lost money after transaction costs.
That’s why I always prefer asking:
What is my actual return on capital?
Not:
How much higher was my selling price?
Third, 2021 to 2026 Was a Very Specific Market
This matters too.
The statistic covers purchases and subsales occurring between 2021 and August 2026.
That period coincided with a significant increase in Singapore private residential prices.
That doesn’t invalidate the data.
But it means I would be careful about turning the result into a timeless rule:
“98% of new launches make money.”
That’s not what the study says.
A different property cycle could produce a very different result.
The same issue appears in stocks.
Suppose I analyse every technology IPO bought in the middle of a strong bull market and sold two years later.
If 90% made money, have I proven technology IPOs are always good investments?
Or have I partly measured the environment in which those investments happened?
Investment returns come from both:
Asset selection
And
Market conditions.
We need to separate the two.


Even Within the Same Data, Location Mattered
The headline also hides significant variation.
Within EdgeProp’s sample, loss-making subsales represented:
7.1% in the CCR
1.9% in the RCR
And just
0.7% in the OCR.
That is a huge difference.
So even during a period when the overwhelming majority of subsales were profitable, different market segments behaved differently.
This is why I don’t particularly like statements such as:
“New launch always makes money.”
Which new launch?
At what entry price?
What unit type?
Which district?
How much competing supply?
How large is the future buyer pool?
What alternatives will buyers have when you want to exit?
Property returns happen at the unit level, not at the slogan level.
The Losers Are Often More Educational Than the Winners
There was another interesting part of EdgeProp’s analysis.
Losses were concentrated disproportionately among certain projects and smaller unit types.
One Pearl Bank and Normanton Park alone accounted for 16 of the 76 loss-making subsales in the dataset.
That doesn’t mean those are bad developments.
But it raises much more useful questions:
Why did those particular units lose money?
Were they initially priced aggressively?
Was competition stronger at exit?
Were buyers more sensitive to the quantum?
Was there a mismatch between investor-heavy supply and future owner-occupier demand?
Those questions can teach us far more than simply celebrating the profitable transactions.
In investing, I’ve often found that studying what went wrong is more useful than studying what went right.
Success can occasionally hide mistakes because a rising market bails you out.
Losses tend to reveal weaknesses much more clearly.
Subscribe to our newsletter if you enjoy insights like this.
Does This Mean New Launches Are Bad Investments?
No.
That would be just as lazy as saying the 98.3% number proves they are automatically good investments.
There are structural reasons why a well-selected new launch can perform well.
The initial group of buyers enters at roughly the beginning of the project’s pricing history.
Developers may progressively raise prices as the project sells.
Construction takes several years, during which surrounding replacement costs and competing launch prices may rise.
And by completion, the property becomes available to a broader resale buyer pool.
Those dynamics can work in your favour.
But they don’t replace fundamentals.
Entry price still matters.
Supply still matters.
Layout still matters.
Project density still matters.
Transaction depth still matters.
Future competition still matters.
The buyer pool still matters.
Statistics Should Start the Analysis, Not End It
If someone tells me:
“98.3% of subsales made money.”
My response isn’t:
“That’s wrong.”
Because it isn’t.
My response is:
“Interesting. What exactly does the denominator contain?”
That’s a habit I think every investor should develop.
Whenever we see a powerful statistic, ask:
What population was measured?
What period was measured?
Who was excluded?
How was profit calculated?
And does the statistic actually answer the question I’m trying to answer?
The headline tells us something genuinely useful:
A very high proportion of completed Singapore condo subsales from 2021 to August 2026 sold above their original purchase prices.
That’s impressive.
But it does not prove that 98.3% of all new-launch buyers made money.
It does not include unsold positions.
It does not fully account for transaction costs.
And it does not guarantee the next five years will resemble the last five.
That’s the difference between reading data...
And investing with it.


Comments